
Consul Toolbelt #1: Instance Health


These toolbelt uses aren’t enough to warrant a full Consul install, but if you are already running Consul there are some neat things you can do with it. This post is part of a series that highlights some of those uses.
While the front page of the site does mention failure detection, it’s phrased around service discovery and health checks, but there is another advantage to Consul’s gossip across your fleet. Suddenly you can now detect bad hosts or hosts with irregular network performance through Serf.
Bare-metal or in the cloud, this is something you’ve run across if you’ve run at scale, and it can be difficult to detect even with measuring packet loss or other network statistics across your fleet. The good thing is that the gossip and Serf health in Consul is doing just that. If you’ve got some regular network detection tools and metrics this post may not be for you, but Consul has an advantage over typical tools, as it uses correlation from several network points to determine health.
Datadog has great metrics for Consul, but if you start seeing some oddities you are still going to need to dig into the logs to see what’s up. While this post covers some metrics for Consul, the telemetry provided natively is far more extensive than what is covered here. The approaches here are mostly for fun and research and intended to illustrate what you can do, not how you should do it, in your production infrastructure.
Here’s what we’ll go over in this post:
- Lifecycle of an instance as viewed by Consul
- Useful log lines from Consul to help detect networking issues and a brief summary of what they mean
- Using Cloudwatch logs with Consul and generating metrics from them
Important Bits
- If you can afford to do so, set your Consul logging level to TRACE or DEBUG. Without these logs it is going to be challenging to fully understand what may be happening.
- Graphing isn’t enough, it is only a leading indicator or enough to point you in the right direction. It is often not enough to fix the issue. I investigated putting this in to Honeycomb.io but for this simple test but I don’t have a way to translate these logs out to the supported Honeycomb formats. It could be a cool use case though.
- It’s important to have all the logs centralized. In a gossip based system you’ll need to roughly calculate each nodes individual view of the world. There is convergence time and other factors where only part of the cluster may think a node is unhealthy. Flapping can be common. Looking at a single log file can be misleading, was it the source or destination node that has a problem? Did it get the message from someone else? Consul has great coordinated checks so a single node doesn’t make the full decision on failures. Using this information can help lead you to locating the source of problems.
- Things are often not as they seem at first glance. If you are new to Consul and you install it across your infrastructure, you’re likely to find a bunch of failures and issues. It’s easy to blame Consul issues for this, but it is more likely Consul will discover issues you didn’t know you already had.
- This test doesn’t cover nearly everything that can happen and is only a simulation or example of what you can do with this information. Some of the settings used to simulate network issues are far from perfect.
- I chose to use Docker only for the simplicity of integration with centralized AWS CloudWatch logs. The results here do not require Docker or AWS CloudWatch logs although they do use them for metrics and centralized logging.
- This will also illustrate how to setup Consul monitoring with metrics from CloudWatch Logs. Other tools can do similar.
- I am not an expert on Consul or the code, the examples particularly in the source code links don’t dive into great detail.
The Test Environment
We will boot 50 instances(and 3 servers) on AWS of the smallest type possible(t2.nano) as those are probably our best bet for hitting limits or running into issues to illustrate what we are after in these tests. We will run the Consul server nodes are slightly larger instances(t2.small)
Our test environment and setup do not mirror production and are for examples only.
The Setup
Is on GitHub here: https://github.com/pshima/consul-toolbelt/tree/master/instance-health
For repeatability the test setup was mostly created with Terraform. For the network simulation this script was used:
Instance Lifecycle
Let’s start out with something simple — what does it look like when an instance comes up and then just disappears due to EC2 health issues(simulated 99.9% packet loss in our case).
Our first join event from the cluster:
2017/08/20 18:39:44 [INFO] serf: EventMemberJoin: ip-10–0–0–190 10.0.0.190
And the last
2017/08/20 18:39:49 [DEBUG] serf: messageJoinType: ip-10–0–0–190
This is interesting to note because it took the entire 53 node cluster only 5 seconds to converge that this node was now alive.
At 20:27:08 we issue the command to drop network traffic and just over 60 seconds later the member has been detected as failed.
2017/08/20 20:28:14 [DEBUG] memberlist: Failed ping: ip-10–0–0–190 (timeout reached)
And 17 seconds later the instance is marked as failed with 2 peer confirmations of the failure. This is a critical point — the node had to have 3 separate indications of failure before truly being marked as failed and this happened about 90 seconds after we dropped traffic. Very cool.
2017/08/20 20:28:31 [INFO] memberlist: Marking ip-10–0–0–190 as failed, suspect timeout reached (2 peer confirmations)
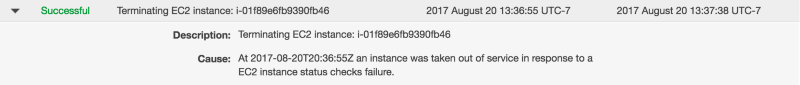
The nodes continue to try and contact -190 but at 20:36(13:36 local time) EC2 terminates the instance. This was 9 minutes after we started dropping traffic but Consul detected and marked it for failure in just 1.5 minutes. In a world where so many things are measured in minutes just to get enough data it is refreshing to see health checking make a decision in 1.5 minutes after a 17 second detection. Sure beats EC2 health checks.
Examining the Logs
So what are some interesting items in the Consul log entries to help you find some of these things?
With the awslogs tool we quickly extract all the logs across all 53 nodes locally for analysis. We could use the direct filtering abilities in awslogs but let’s stick with the more common command line utilities.
% awslogs get consul-toolbelt ALL — start=’2h ago’ > logs.all
Let’s start with a simple grep for ‘ERR’
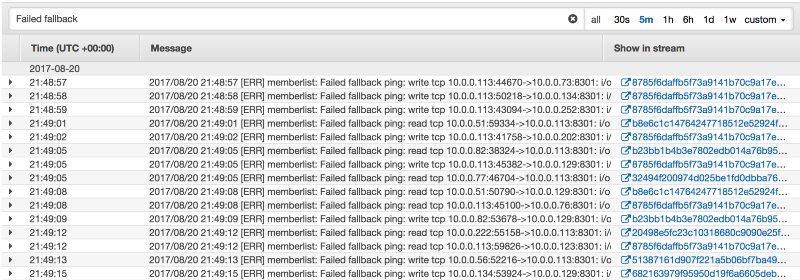
Failed Fallback Pings
2017/08/20 19:24:34 [ERR] memberlist: Failed fallback ping: write tcp 10.0.0.88:34898->10.0.0.189:8301: i/o timeout
Yamux Keepalive Failures
2017/08/20 20:18:56 [ERR] yamux: keepalive failed: i/o deadline reachedConsul RPC Failures
2017/08/20 20:18:56 [ERR] consul.rpc: multiplex conn accept failed: keepalive timeout from=10.0.0.88:53467
And on to ‘WARN’
Refuting Suspect Messages
2017/08/20 18:43:30 [WARN] memberlist: Refuting a suspect message (from: ip-10-0-0-52)
Memberlist Connection Issues
2017/08/20 20:04:32 [WARN] memberlist: Was able to connect to ip-10-0-0-76 but other probes failed, network may be misconfigured
So this is a good starting point, and it’s interesting to note most of the errors and warnings are from memberlist and yamux.
Failed Fallback Pings
These can be seen here: https://github.com/hashicorp/memberlist/blob/bb21552b37d804bddbf4516db355e092f793f164/state.go#L368
According to the code comments, the fallback ping is used in the place of UDP pings when they start failing. This is a great feature as UDP traffic can be by nature unreliable, so falling back to a TCP ping is pretty sweet. This is a good leading indicator of an issue and something we may want metrics for.
sendPingAndWaitForAck can be found here which looks to be using an implementation of https://golang.org/pkg/net/#Dial
A pretty straight forward network connection. If this isn’t working, and fallback to TCP also isn’t working, something is wrong.
Yamux Keepalive Failures
We can find these here: https://github.com/hashicorp/yamux/blob/d1caa6c97c9fc1cc9e83bbe34d0603f9ff0ce8bd/session.go#L306
According to the comments this is a running ping to keepalive the yamux connection. The ping here is used to measure the RTT time: https://github.com/hashicorp/yamux/blob/d1caa6c97c9fc1cc9e83bbe34d0603f9ff0ce8bd/session.go#L263
This implementation looks slightly different than the failed fallback pings. It looks like it’s sending a SYN packet and calculating the response time. This is probably not good if the destination isn’t able to respond to a SYN but it also doesn’t really tell us much more than the fallbacks. The fallbacks already tell us there are connectivity issues across TCP and UDP.
Consul RPC failures
These can be found here: https://github.com/hashicorp/consul/blob/d42c743c84eab122fd7526bca6d7033fd1d179bf/agent/consul/rpc.go#L135
This appears to be utilizing the above yamux multiplexer so I don’t think that helps us much. The yamux errors are likely correlated.
Refuting Suspect Messages
This can be found here: https://github.com/hashicorp/memberlist/blob/bb21552b37d804bddbf4516db355e092f793f164/state.go#L1034
So this is a really neat and interesting part of Consul and memberlist. If I get a message from another node that says I am an unhealthy node then I can refute that message and say no, here I am and I am healthy.
This is probably one of the more interesting and useful log entries. It shows us that something has gone wrong but in one way or another was transient or illustrates network issues between only a subset of nodes. If this is happening often it most definitely needs to be investigated.
Memberlist connection issues
So this is close to the failed fallback issues above and only a few lines of code away: https://github.com/hashicorp/memberlist/blob/bb21552b37d804bddbf4516db355e092f793f164/state.go#L393
But the interesting case here is we failed to contact the node, but then the fallback channel did work. The more likely case here would be when UDP was not working but TCP was, this message would be useful for detecting when UDP specific issues were happening.
Other Entries
There are plenty of other interesting entries in the logs. We did not use the default ping failure message as those are likely to occur and we shouldn’t care much about single ping failures. This is different than the fallback ping failures as there were several tries along the way before we reached that stage. No route to host errors were also present when hosts completely died, but we can detect that in other ways and isn’t interesting with the other data.
Metrics from Logs
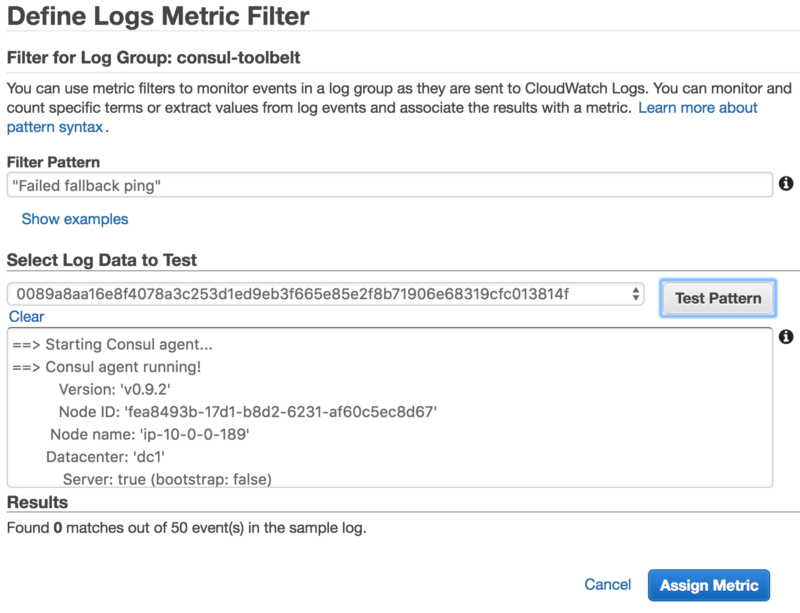
One of the great features of CloudWatch Logs is to be able to easily generate metrics from them. Let’s look at what some of the helpful configurations might look like from the above errors.
We can create a Metric Filter on our AWS CloudWatch Logs log group pretty easily with just the string matching we have above.
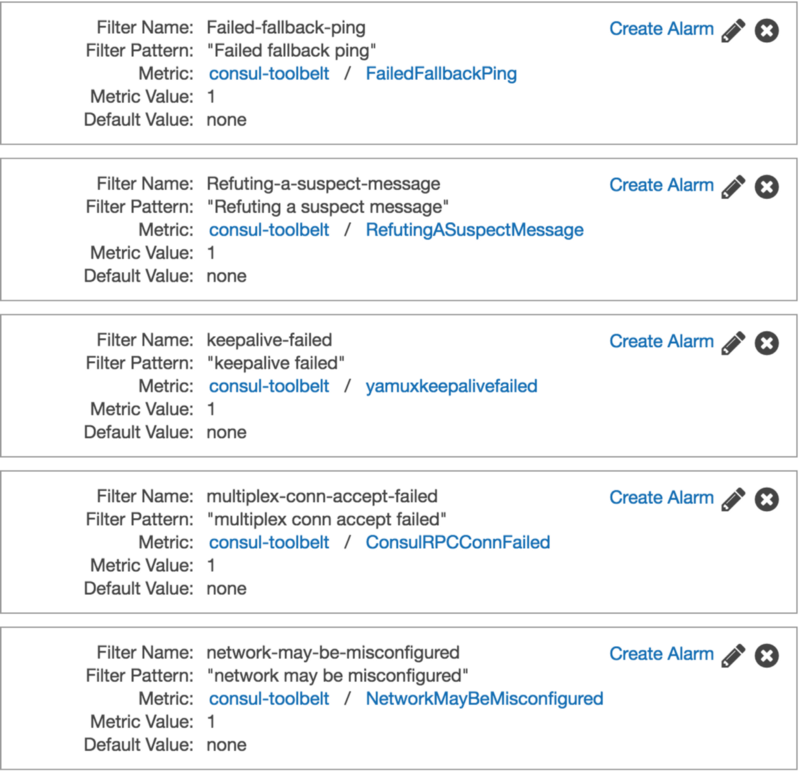
With these setup we could now also setup some basic alarming if we wanted to, and then with CloudWatch Logs dive in to the log entries and locate what nodes are causing havoc.
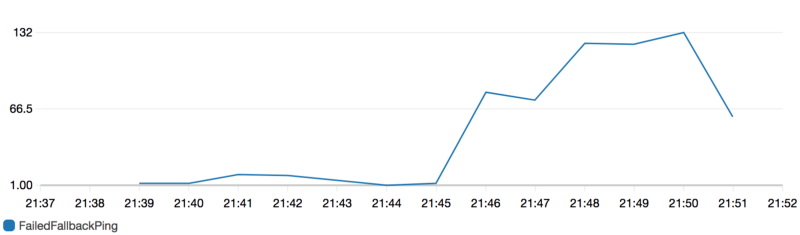
Failed Fallback Ping Graph — Count Per Minute
Triangulation
With the above we now have some simple monitoring and debugging we can use to detect network issues across our fleet.
Given the above graph we can see there are over 100 Failed Fallback Pings per minute.
The AWS CloudWatch Logs console can give us a quick view of the logs
Or the awslogs tool can give us quick output of the logs that we can grep across.
`% awslogs get consul-toolbelt ALL -w | grep 'Failed fallback'
consul-toolbelt 8785f6daffb5f73a9141b70c9a17e572bf93bc1aba96395e80bcbe05afec6432 2017/08/20 21:50:12 [ERR] memberlist: Failed fallback ping: read tcp 10.0.0.113:57602->10.0.0.63:8301: i/o timeout
consul-toolbelt 1242f2d1fb4e5412d68541912e4fa25529c231798ea94a70fbcfc38fdc173576 2017/08/20 21:50:14 [ERR] memberlist: Failed fallback ping: read tcp 10.0.0.240:44552->10.0.0.113:8301: i/o timeout
consul-toolbelt 8785f6daffb5f73a9141b70c9a17e572bf93bc1aba96395e80bcbe05afec6432 2017/08/20 21:50:14 [ERR] memberlist: Failed fallback ping: read tcp 10.0.0.113:41928->10.0.0.52:8301: i/o timeout
consul-toolbelt 8785f6daffb5f73a9141b70c9a17e572bf93bc1aba96395e80bcbe05afec6432 2017/08/20 21:50:15 [ERR] memberlist: Failed fallback ping: write tcp 10.0.0.113:55866->10.0.0.187:8301: i/o timeout
consul-toolbelt 8785f6daffb5f73a9141b70c9a17e572bf93bc1aba96395e80bcbe05afec6432 2017/08/20 21:50:16 [ERR] memberlist: Failed fallback ping: read tcp 10.0.0.113:44968->10.0.0.103:8301: i/o timeout
consul-toolbelt 8785f6daffb5f73a9141b70c9a17e572bf93bc1aba96395e80bcbe05afec6432 2017/08/20 21:50:17 [ERR] memberlist: Failed fallback ping: read tcp 10.0.0.113:50382->10.0.0.134:8301: i/o timeout
`
With this it becomes pretty easy to pick out the outliers using our standard command line utils.
% awslogs get consul-toolbelt ALL --start='5m ago' | grep -o '10.0.0.[0-9]*' | sort | uniq -c | sort -nr | head -n 10
 199 10.0.0.113
 178 10-0-0-113
  66 10.0.0.56
  58 10.0.0.192
  48 10.0.0.83
  44 10-0-0-56
  37 10-0-0-192
  27 10.0.0.88
  27 10-0-0-83
  24 10.0.0.190
10.0.0.113, while under 2 different formats is still any easy choice of our top offender. Since many different nodes communicate with this node others will appear throughout the list and we can use this to help us locate our root cause(just me with tc).
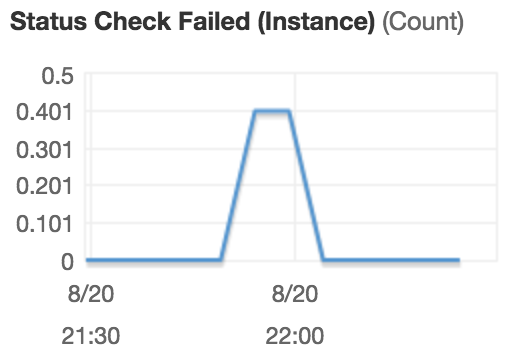
10.0.0.113 Status Check
Summary
I hope this post was useful to you. If you’ve found other things that have helped you find outlier hosts with Consul, let me know.
This post covers just some lesser known Consul topics as part of a series called Consul Toolbelt. Tips for people already running Consul.