
Monitoring your home network with InfluxDB on Raspberry Pi with Docker
Backstory
Over a year ago I was having all sorts of networking problems at home, major packet loss, complete networking outages and more. They were spurious, unpredictable and hard to diagnose. I wasn’t sure if it was my desktop/laptop, phone, wireless, or my internet provider.
So I decided to put a Raspberry Pi 2 on my network with InfluxDB, telegraf and grafana with some network monitors in place. I need historical data because the issues I was seeing were sporadic.
I’ve used it over the past year to debug many issues and this year I’m polishing it up with a new setup on a Raspberry Pi 3.
Preface
These instructions are set for a Mac and a Pi 2 or 3 using raspbian 9 Stretch. This expects you know the basics of running Linux and a Raspberry Pi.
Initial Setup
First we download Etcher and the raspbian image. We use this to drop the image in the SD card we use in the Pi. We want the lite image, however the full image may work just fine as well.
Download Raspbian for Raspberry Pi
Next for a Pi3 we need to connect it to the wifi.
Setting WiFi up via the command line - Raspberry Pi Documentation
Then we enable SSH to remotely connect to the Pi.
SSH (Secure Shell) - Raspberry Pi Documentation
After that we can now remotely connect.
% ssh pi@172.16.1.200
pi@172.16.1.200’s password:
Linux raspberrypi 4.9.59-v7+ #1047 SMP Sun Oct 29 12:19:23 GMT 2017 armv7l
The programs included with the Debian GNU/Linux system are free software;
the exact distribution terms for each program are described in the
individual files in /usr/share/doc/*/copyright.Debian GNU/Linux comes with ABSOLUTELY NO WARRANTY, to the extent
permitted by applicable law.
Last login: Tue Dec 26 19:19:27 2017 from 172.16.1.86
pi@raspberrypi:~ $
Now that the Pi is setup time to install our software packages.
Setup Docker
Install docker-ce via https://docs.docker.com/engine/installation/linux/docker-ce/debian/#install-using-the-convenience-script
Shortcut is
pi@raspberrypi:~/docker $ curl -fsSL get.docker.com -o get-docker.sh
pi@raspberrypi:~/docker $ sudo sh get-docker.sh
Check that docker is running
pi@raspberrypi:~ $ docker ps
CONTAINER ID IMAGE COMMAND CREATED STATUS PORTS NAMES
pi@raspberrypi:~ $
Setup InfluxDB
For this we use a pre built container: https://github.com/hypriot/rpi-influxdb
sudo docker run -d --volume=/var/influxdb:/data -p 8086:8086 hypriot/rpi-influxdb
Now when running this I got this error:
pi@raspberrypi:~ $ sudo docker run -d --volume=/var/influxdb:/data -p 8086:8086 hypriot/rpi-influxdb
9499d9a93862749fa6573dde8d0b6303751d2985e74d7612a84c3ac866f1a07e
docker: Error response from daemon: cgroups: memory cgroup not supported on this system: unknown.
Which lead me to this issue: https://github.com/moby/moby/issues/35587
And leads me to this specific comment on how to fix: https://github.com/moby/moby/issues/35587#issuecomment-353976863
After that, reboot.
And now we’ve got influxdb running
pi@raspberrypi:~ $ sudo docker run -d --volume=/var/influxdb:/data -p 8086:8086 hypriot/rpi-influxdb
c10b584e321034f5f360be506ba36b80142054af11162828a792bb66bb64146f
pi@raspberrypi:~ $ sudo docker ps
CONTAINER ID        IMAGE                  COMMAND                  CREATED             STATUS              PORTS                    NAMES
c10b584e3210        hypriot/rpi-influxdb   "/usr/bin/entry.sh /…"   23 seconds ago      Up 21 seconds       0.0.0.0:8086->8086/tcp   sad_neumann
Now we need to follow the rest of the instructions to initialize the influxdb database
`pi@raspberrypi:~ $ sudo docker exec -it c10b584e3210 /usr/bin/influx
Connected to http://localhost:8086 version 1.2.2
InfluxDB shell version: 1.2.2
> CREATE DATABASE db1
> SHOW DATABASES
name: databases
name
_internal
db1``> USE db1
Using database db1
> CREATE USER root WITH PASSWORD 'passhere' WITH ALL PRIVILEGES
> GRANT ALL PRIVILEGES ON db1 TO root
> SHOW USERS
user admin
root true`
Setting up Telegraf
We’re going to use telegraf as our local agent to collect metrics and statistics. https://hub.docker.com/r/arm32v7/telegraf/
We have to use the arm32v7 version
pi@raspberrypi:~ $ sudo docker run --net=container:c10b584e3210 arm32v7/telegraf
Unable to find image 'arm32v7/telegraf:latest' locally
latest: Pulling from arm32v7/telegraf
Digest: sha256:7da91efbb3e228a31d3859daa0609c91f8c76970dd966a20d9e65e5193cff40a
Status: Downloaded newer image for arm32v7/telegraf:latest
2017/12/26 21:35:15 I! Using config file: /etc/telegraf/telegraf.conf
2017-12-26T21:35:15Z I! Starting Telegraf v1.5.0
2017-12-26T21:35:15Z I! Loaded outputs: influxdb
2017-12-26T21:35:15Z I! Loaded inputs: inputs.mem inputs.processes inputs.swap inputs.system inputs.cpu inputs.disk inputs.diskio inputs.kernel
2017-12-26T21:35:15Z I! Tags enabled: host=c10b584e3210
2017-12-26T21:35:15Z I! Agent Config: Interval:10s, Quiet:false, Hostname:"c10b584e3210", Flush Interval:10s
Now let’s generate a config file we can mount into the container
sudo docker run --rm arm32v7/telegraf telegraf config > telegraf.conf
And we can modify it as needed, we won’t do that quite yet though, but now we can run the container mounted with the local config file
docker run `--net=container:c10b584e3210 `-v $PWD/telegraf.conf:/etc/telegraf/telegraf.conf:ro arm32v7/telegraf
Setup Grafana
More recently there are now 3rd party grafana docker containers on docker hub which makes this considerably easier
https://hub.docker.com/r/fg2it/grafana-armhf/
docker run -i -p 3000:3000 --name grafana fg2it/grafana-armhf:v4.1.2
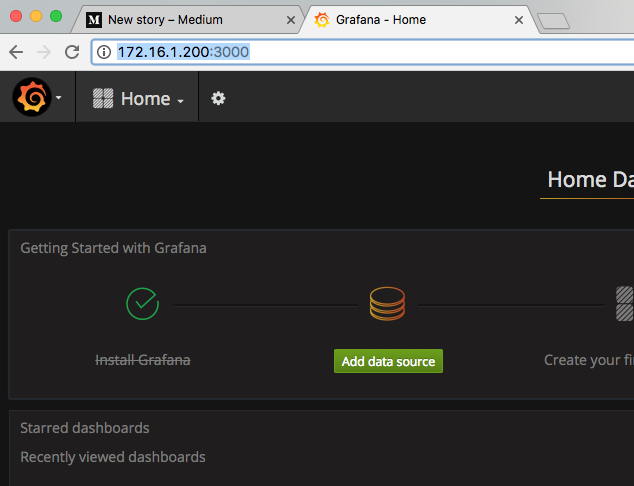
Now we can test by hitting the grafana endpoint and logging in with admin:admin
Voila

But adding the data source fails. Trying to run the container with the existing influxdb networked container fails as well.
pi@raspberrypi:~ $ docker run --net=container:c10b584e3210 -i -p 3000:3000 --name grafana fg2it/grafana-armhf:v4.1.2
docker: Error response from daemon: conflicting options: port publishing and the container type network mode.
See 'docker run --help'.
This is a subtetly of docker networking and docker has several modes of networking. In this case we are going to just use host based networking for simplicity.
Pulling things together.
So far we’ve done the basics of booting the three software packages together to ensure that has worked but now we need to reconfigure them to work together and to start on boot. After that we can start customizing our configuration.
First we need to stop all the containers we have running. The first steps were just to make sure everything ran.
pi@raspberrypi:~ $ docker ps
CONTAINER ID        IMAGE                  COMMAND                  CREATED             STATUS              PORTS                    NAMES
c10b584e3210        hypriot/rpi-influxdb   "/usr/bin/entry.sh /…"   About an hour ago   Up About an hour    0.0.0.0:8086->8086/tcp   sad_neumann
pi@raspberrypi:~ $ docker stop c10b584e3210
c10b584e3210
pi@raspberrypi:~ $ docker ps
CONTAINER ID        IMAGE               COMMAND             CREATED             STATUS              PORTS               NAMES
pi@raspberrypi:~ $
Since we are only planning on running monitoring on this pi, we can just use docker host networking.
Start influxdb using host networking.
pi@raspberrypi:~ $ sudo docker run --rm -d --name=influxdb --net=host --volume=/var/influxdb:/data hypriot/rpi-influxdb
2e30695d09b2baac36653fca83fc5d797c9bf3d6243c831543beeb7121463811
And run telegraf
pi@raspberrypi:~ $ sudo docker run --rm -d --net=host --name telegraf -v $PWD/telegraf.conf:/etc/telegraf/telegraf.conf:ro arm32v7/telegraf
616a096391fcda76c111528e6e568dff9c6159a49f7c18ef1498fd9f108e6487
First let’s create some persistent storage for grafana
pi@raspberrypi:~ $ sudo docker run -d -v /var/lib/grafana –name grafana-storage busybox:latest``
And then run grafana with the persistent storage
pi@raspberrypi:~ $ sudo docker run --rm -d --net=host --name grafana --volumes-from grafana-storage fg2it/grafana-armhf:v4.1.2
de31ad82e994f579bb3aff0a3765152c8af3d290b1ce66fd04bb728c99a72e3d
Verify the install
Before we get to the monitoring we should verify the install is working.
First we can tail all the docker logs
Influx
pi@raspberrypi:~ $ docker logs influxdb
=> Starting InfluxDB ...
=> No database need to be pre-created
exec influxd -config=${CONFIG_FILE}
            <omitted>
[I] 2017-12-28T17:43:00Z Listening for signals
[I] 2017-12-28T17:43:00Z Sending usage statistics to usage.influxdata.com
[httpd] 127.0.0.1 - - [28/Dec/2017:17:43:00 +0000] "POST /write?consistency=any&db=telegraf HTTP/1.1" 204 0 "-" "-" 8c1abea5-ebf6-11e7-8001-000000000000 15528
[httpd] 127.0.0.1 - - [28/Dec/2017:17:43:00 +0000] "POST /write?consistency=any&db=telegraf HTTP/1.1" 204 0 "-" "-" 8c1d763e-ebf6-11e7-8002-000000000000 18108
Telegraf
2017/12/28 17:44:20 I! Using config file: /etc/telegraf/telegraf.conf
2017-12-28T17:44:20Z I! Starting Telegraf v1.5.0
2017-12-28T17:44:20Z I! Loaded outputs: influxdb
2017-12-28T17:44:20Z I! Loaded inputs: inputs.kernel inputs.mem inputs.processes inputs.swap inputs.system inputs.cpu inputs.disk inputs.diskio
2017-12-28T17:44:20Z I! Tags enabled: host=raspberrypi
2017-12-28T17:44:20Z I! Agent Config: Interval:10s, Quiet:false, Hostname:"raspberrypi", Flush Interval:10s
Grafana
pi@raspberrypi:~ $ docker logs grafana
t=2017-12-28T17:42:45+0000 lvl=info msg="Starting Grafana" logger=main version=4.1.2 commit=v4.1.2 compiled=2017-02-13T12:13:31+0000
t=2017-12-28T17:42:45+0000 lvl=info msg="Config loaded from" logger=settings file=/usr/share/grafana/conf/defaults.ini
t=2017-12-28T17:42:45+0000 lvl=info msg="Config loaded from" logger=settings file=/etc/grafana/grafana.ini
t=2017-12-28T17:42:45+0000 lvl=info msg="Config overriden from command line" logger=settings arg="default.paths.data=/var/lib/grafana"
t=2017-12-28T17:42:45+0000 lvl=info msg="Config overriden from command line" logger=settings arg="default.paths.logs=/var/log/grafana"
t=2017-12-28T17:42:45+0000 lvl=info msg="Config overriden from command line" logger=settings arg="default.paths.plugins=/var/lib/grafana/plugins"
t=2017-12-28T17:42:45+0000 lvl=info msg="Path Home" logger=settings path=/usr/share/grafana
t=2017-12-28T17:42:45+0000 lvl=info msg="Path Data" logger=settings path=/var/lib/grafana
t=2017-12-28T17:42:45+0000 lvl=info msg="Path Logs" logger=settings path=/var/log/grafana
t=2017-12-28T17:42:45+0000 lvl=info msg="Path Plugins" logger=settings path=/var/lib/grafana/plugins
t=2017-12-28T17:42:45+0000 lvl=info msg="Initializing DB" logger=sqlstore dbtype=sqlite3
t=2017-12-28T17:42:45+0000 lvl=info msg="Starting DB migration" logger=migrator
t=2017-12-28T17:42:45+0000 lvl=info msg="Executing migration" logger=migrator id="copy data account to org"
t=2017-12-28T17:42:45+0000 lvl=info msg="Skipping migration condition not fulfilled" logger=migrator id="copy data account to org"
t=2017-12-28T17:42:45+0000 lvl=info msg="Executing migration" logger=migrator id="copy data account_user to org_user"
t=2017-12-28T17:42:45+0000 lvl=info msg="Skipping migration condition not fulfilled" logger=migrator id="copy data account_user to org_user"
t=2017-12-28T17:42:45+0000 lvl=info msg="Starting plugin search" logger=plugins
t=2017-12-28T17:42:45+0000 lvl=info msg="Initializing Alerting" logger=alerting.engine
t=2017-12-28T17:42:45+0000 lvl=info msg="Initializing CleanUpService" logger=cleanup
t=2017-12-28T17:42:45+0000 lvl=info msg="Initializing HTTP Server" logger=server address=0.0.0.0:3000 protocol=http subUrl=
If all is well we can then setup Grafana. There are other tests we can run here to verify and I might add them later.
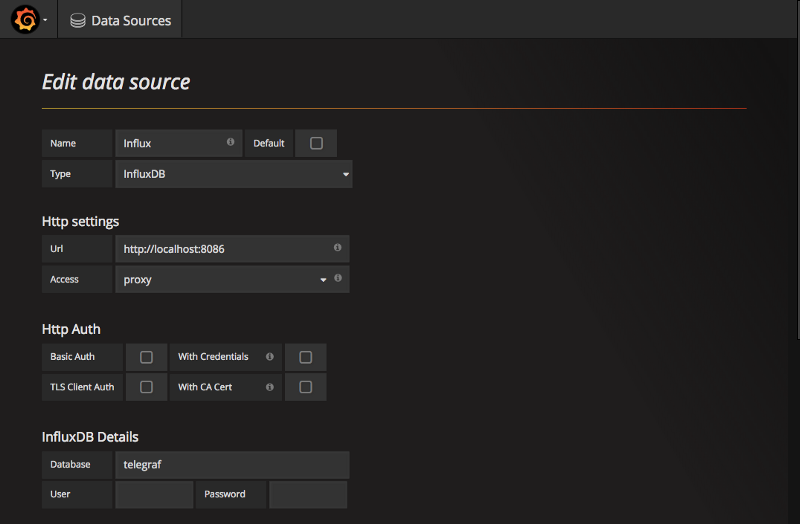
Setup Grafana Datasource
When loading up grafana at http:<ip>:3000 we are presented with the front page again and can move on to configuring a basic influx datasource
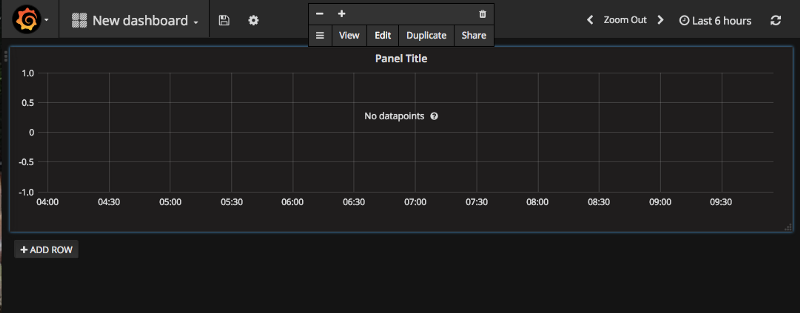
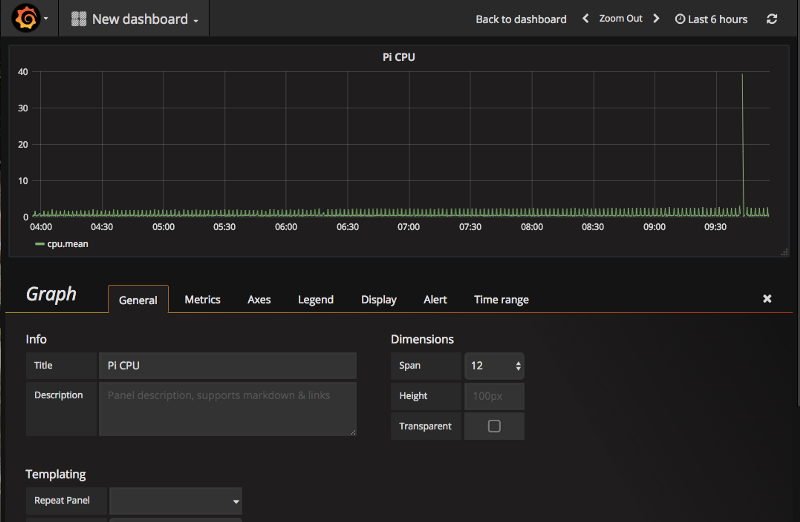
With the data source setup we can now setup a new dashboard. To test things out we will graph performance of the Pi itself, then add our networking monitoring graphs.
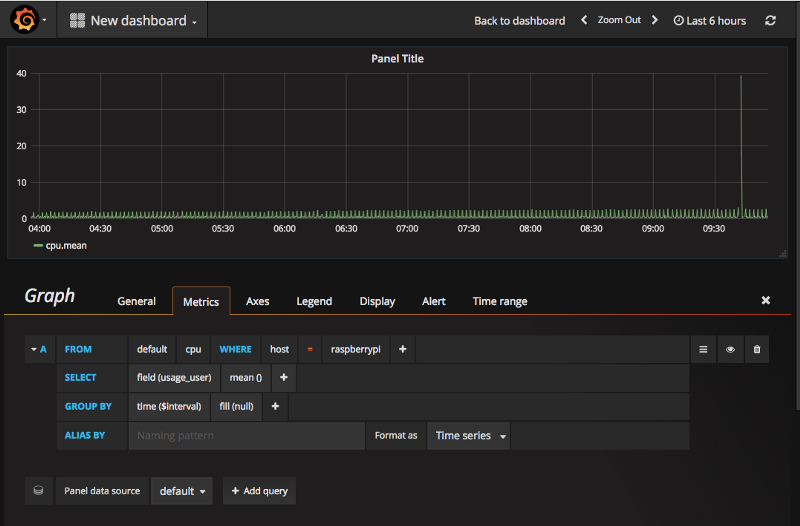
Hitting the edit button on the Panel Title allows us to edit it.
And we can get a simple graph together of average CPU as a test.
Adding basic monitoring
With the above we should now have a working monitoring setup, we just need to add some checks to it.
With influxdb and telegraf this is pretty easy right out of the box. In the telegraf.conf file (initially mapped right in the pi user home dir) we are going to change a few of the inputs.
Scrolling through the default file you will see settings regarding the agent, outputs aggregators and inputs. You’ll also notice that most of the items are commented out except our existing host metrics like [[inputs.cpu]] which we used to graph above.
We want to start by modifying [[inputs.dns_query]]
# # Query given DNS server and gives statistics
[[inputs.dns_query]]
  ## servers to query
  servers = ["8.8.8.8", "4.2.2.1"] # required
## Domains or subdomains to query. "."(root) is default
domains = ["[www.google.com](http://www.google.com)"] # optional## Query record type. Default is "A"
## Posible values: A, AAAA, CNAME, MX, NS, PTR, TXT, SOA, SPF, SRV.
record_type = "A" # optional## Dns server port. 53 is default
port = 53 # optional## Query timeout in seconds. Default is 2 seconds
timeout = 2 # optional
Here we are setting up telegraf to do a dns query for www.google.com against 2 common DNS servers. You should also input the DNS server you use on your local network as well. With this we will get graphs for DNS response time.
Next we want to modify [[inputs.ping]]
`# # Ping given url(s) and return statistics
[[inputs.ping]]
NOTE: this plugin forks the ping command. You may need to set capabilities
via setcap cap_net_raw+p /bin/ping
urls to ping
urls = ["www.github.com","www.amazon.com","8.8.8.8","4.2.2.1","172.16.1.1"]
number of pings to send per collection (ping -c <COUNT>)
count = 3
interval, in s, at which to ping. 0 == default (ping -i <PING_INTERVAL>)
ping_interval = 15.0
per-ping timeout, in s. 0 == no timeout (ping -W <TIMEOUT>)
timeout = 10.0
interface to send ping from (ping -I <INTERFACE>)
interface = "wlan0"`
Here we setup ping monitoring to some popular sites, our DNS servers and something on our local network. If you are using ethernet instead of wifi (standard on Pi2) then you’ll want to change the interface to “eth0”
With the note in the ping plugin comments we also need to allow pings
pi@raspberrypi:~ $ sudo setcap cap_net_raw+p /bin/ping
Otherwise we will see something like this in our telegraf log:
2017-12-28T18:21:50Z E! Error in plugin [inputs.ping]: Fatal error processing ping output: 8.8.8.8
2017-12-28T18:21:50Z E! Error in plugin [inputs.ping]: Fatal error processing ping output: 172.16.1.1
2017-12-28T18:21:50Z E! Error in plugin [inputs.ping]: Fatal error processing ping output: 4.2.2.1
There is also a pretty silly issue in the standard telegraf docker container we used. The version of ping that is installed isn’t compatible with it’s own ping plugin. There is an open issue for this here that you will need to use as a workaround until it is fixed: https://github.com/influxdata/telegraf/issues/3295
You can also see throughout the config file there are many other things we can enable to graph if we wanted as well. [[inputs.http_response]] is something you may want to enable as well.
After changing the configuration we just restart telegraf.
pi@raspberrypi:~ $ sudo docker restart telegraf
telegraf
Setting up the network dashboard
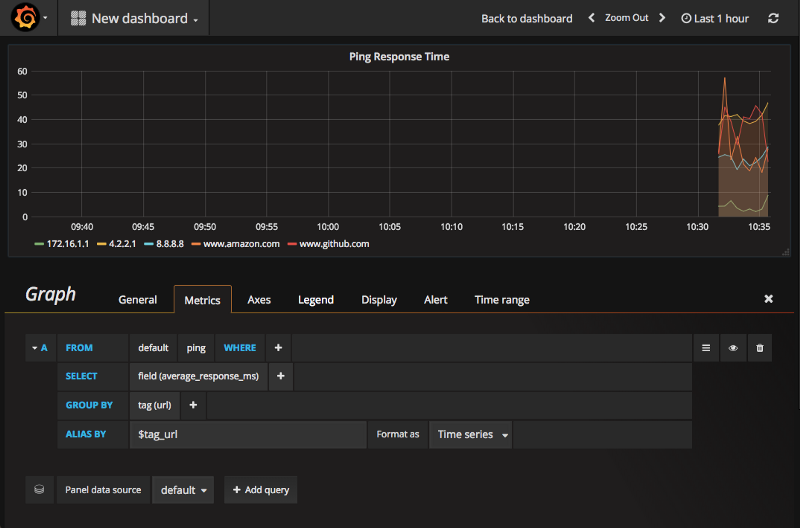
We can setup a new dashboard for ping response time.
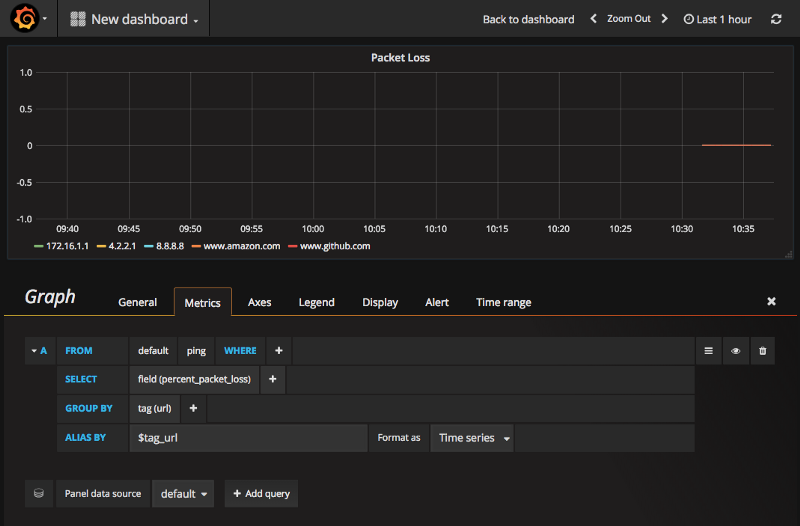
We can also add one for packet loss
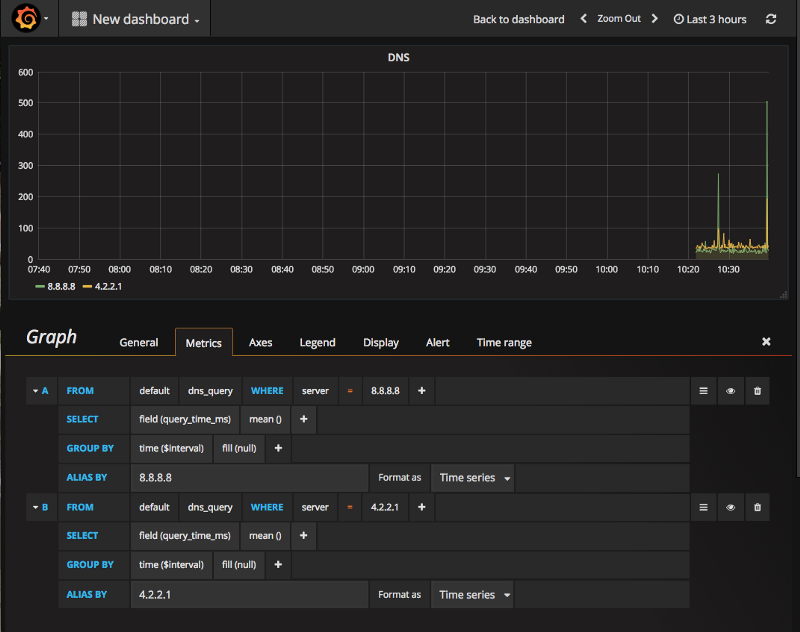
And finally DNS
Summary
Now we’ve got monitoring in place and a dashboard setup to review it as needed. For about $50 we’ve now got a flexible monitoring solution that can be plugged in pretty much anywhere on your network to give you another view of network performance.
Now whenever I have a networking issue I can load up these graphs to get the Pi’s view of what is happening. Turns out I had several different issues going on and sometimes it was ISP, sometimes wireless and sometimes my local device.