
Monitoring Your Home Network - Updated
Monitoring Your Home Network - Updated
With the pandemic a lot of folks have been at home and on a zoom call that start to lag or chop and you wonder - is it me or is it the person on the other side? If it does end up being on your side what is the problem? Is it your computer? Your Wifi? Your ISP?
The goal of this is to get as close to a basic answer as we can for this, and also to have automatic alerts when we can detect something actually is wrong.
Previous work
In a previous post I walk through how to setup influxdb on a raspberry pi to get basic monitoring for your home network. This post was quite outdated and many things progressed in the past 5 years. It is now quite a bit easier to get this going.
In this post we’re going to cover using Influx 2.0 to get some monitoring and alerting together. I’ll be monitoring several different physical locations to a centralized ec2 instance so if my home network is down I can still get alerted, etc.
We’re going to keep a few things in mind on this post as well: - Most folks probably only need to monitor a single site or network. Steps here should still work at a high level for a box or raspberry pi on a home network. - Cost - since this is just home network monitoring, we want to keep this as cheap as possible, or free if you’ve go the hardware. - Simple - this should be easy and simple to setup with some prior knowledge
We’re going to start with what works and is easy and relatively low cost and then try and reduce cost over time.
What we’re going to monitor
With the above we’re going to look at monitoring the following
- Your ISP (network latency, dns lookups, packet loss, etc)
- Your wifi/local network
- Your computer’s performance and network
- Zoom connectivity, if possible
What we’re using
Since I need to do this at several locations, or my parents or friends house, I want a setup I can use anywhere.
Main influx server
- t2.micro AWS us-west-2. This is going to cost us about $8.50 a month along with bandwidth costs, etc. Or about $100 per year. This is still a pretty high cost that we will look to reduce. We could probably get something at vultr or elsewhere cheaper.
- This same setup should work on a bare metal box anywhere, including raspberry pi. Albeit with a few tweaks.
- I can’t tell how much influx cloud would cost me despite them having a cost page. I have no idea how much data Im going to generate.
Agents/collectors All running telegraf
- Mac OS X (Actual Zoom host)
- Raspberry PI (Local network monitoring)
- Windows (maybe in the future?)
Graphing, Dashboards and Alerting
- Built in influx 2.0 features
Influx 1.0 and 2.0 differences
Death to the TICK stack, Long live the TICK stack! In updating this I discovered that the TICK stack has changed a whole lot from 1.0 to 2.0 requiring me to rebuild this guide and setup.
- No longer need grafana, but could add it later if I wanted
- Kronograf is no longer needed
- Capacitor is no longer needed
This leaves us with Influx, and Telegraf and that’s it, simplifying our setup.
Step 1: Setup InfluxDB host
Details omitted - boot a host on AWS SSH into the host
1.1 Install Docker
Setup docker per: https://docs.docker.com/engine/install/debian/
Make sure docker is working
sudo docker run hello-world
1.2 Get git and the repo/containers setup
Install Git
sudo apt-get install git
Clone the repo
git clone https://github.com/pshima/influx-2-docker.git
cd influx-2-docker/
./boot.sh
Check that its running
sudo docker ps
check the influx logs You should see something like this ending with authorization not found (normal pre init)
ts=2022-07-27T22:23:50.172351Z lvl=info msg="Welcome to InfluxDB" log_id=0bxRzqc0000 version=v2.3.0+SNAPSHOT.090f681737 commit=090f681737 build_date=2022-06-16T19:33:50Zts=2022-07-27T22:23:50.172606Z lvl=warn msg="nats-port argument is deprecated and unused" log_id=0bxRzqc0000
ts=2022-07-27T22:23:50.480712Z lvl=info msg="Resources opened" log_id=0bxRzqc0000 service=bolt path=/var/lib/influxdb2/influxd.bolt
ts=2022-07-27T22:23:50.480822Z lvl=info msg="Resources opened" log_id=0bxRzqc0000 service=sqlite path=/var/lib/influxdb2/influxd.sqlite
ts=2022-07-27T22:23:50.531769Z lvl=info msg="Bringing up metadata migrations" log_id=0bxRzqc0000 service="KV migrations" migration_count=20
ts=2022-07-27T22:23:53.809218Z lvl=info msg="Bringing up metadata migrations" log_id=0bxRzqc0000 service="SQL migrations" migration_count=5
ts=2022-07-27T22:23:53.902927Z lvl=info msg="Using data dir" log_id=0bxRzqc0000 service=storage-engine service=store path=/var/lib/influxdb2/engine/data
ts=2022-07-27T22:23:53.903179Z lvl=info msg="Compaction settings" log_id=0bxRzqc0000 service=storage-engine service=store max_concurrent_compactions=1 throughput_bytes_per_second=50331648 throughput_bytes_per_second_burst=50331648
ts=2022-07-27T22:23:53.903330Z lvl=info msg="Open store (start)" log_id=0bxRzqc0000 service=storage-engine service=store op_name=tsdb_open op_event=startts=2022-07-27T22:23:53.903512Z lvl=info msg="Open store (end)" log_id=0bxRzqc0000 service=storage-engine service=store op_name=tsdb_open op_event=end op_elapsed=0.185msts=2022-07-27T22:23:53.903697Z lvl=info msg="Starting retention policy enforcement service" log_id=0bxRzqc0000 service=retention check_interval=30mts=2022-07-27T22:23:53.903808Z lvl=info msg="Starting precreation service" log_id=0bxRzqc0000 service=shard-precreation check_interval=10m advance_period=30mts=2022-07-27T22:23:53.904990Z lvl=info msg="Starting query controller" log_id=0bxRzqc0000 service=storage-reads concurrency_quota=1024 initial_memory_bytes_quota_per_query=9223372036854775807 memory_bytes_quota_per_query=9223372036854775807 max_memory_bytes=0 queue_size=1024
ts=2022-07-27T22:23:53.907576Z lvl=info msg="Configuring InfluxQL statement executor (zeros indicate unlimited)." log_id=0bxRzqc0000 max_select_point=0 max_select_series=0 max_select_buckets=0ts=2022-07-27T22:23:53.920330Z lvl=info msg=Listening log_id=0bxRzqc0000 service=tcp-listener transport=http addr=:8086 port=8086ts=2022-07-27T22:23:53.920537Z lvl=info msg=Starting log_id=0bxRzqc0000 service=telemetry interval=8hts=2022-07-27T22:24:03.872865Z lvl=info msg=Unauthorized log_id=0bxRzqc0000 error="authorization not found"ts=2022-07-27T22:24:13.873017Z lvl=info msg=Unauthorized log_id=0bxRzqc0000 error="authorization not found"ts=2022-07-27T22:24:23.873161Z lvl=info msg=Unauthorized log_id=0bxRzqc0000 error="authorization not found"ts=2022-07-27T22:24:33.874256Z lvl=info msg=Unauthorized log_id=0bxRzqc0000 error="authorization not found"
Check the telegraf logs
It is normal to see the errors tat the end! We havent setup influx yet! We just want to make sure the containers did actually boot.
2022-07-27T22:23:53Z I! Starting Telegraf 1.23.32022-07-27T22:23:53Z I! Loaded inputs: cpu disk diskio kernel mem processes swap system
2022-07-27T22:23:53Z I! Loaded aggregators:
2022-07-27T22:23:53Z I! Loaded processors: 2022-07-27T22:23:53Z I! Loaded outputs: influxdb_v22022-07-27T22:23:53Z I! Tags enabled: host=influx-server2022-07-27T22:23:53Z I! [agent] Config: Interval:10s, Quiet:false, Hostname:"influx-server", Flush Interval:10s2022-07-27T22:24:03Z E! [outputs.influxdb_v2] When writing to [http://influxdb:8086]: failed to write metric to influxserver (401 Unauthorized): unauthorized: unauthorized access
2022-07-27T22:24:03Z E! [agent] Error writing to outputs.influxdb_v2: failed to send metrics to any configured server(s)
2022-07-27T22:24:13Z E! [outputs.influxdb_v2] When writing to [http://influxdb:8086]: failed to write metric to influxserver (401 Unauthorized): unauthorized: unauthorized access2022-07-27T22:24:13Z E! [agent] Error writing to outputs.influxdb_v2: failed to send metrics to any configured server(s)
1.3 Setup InfluxDB
Change the password below before running
sudo docker exec influxdb influx setup \
  --org admin \
  --bucket influxserver \
  --username admin \
  --password !!ExAmPl3PA55W0rD \
  --retention 30d \
  --force
And then create another one specifically for our client metrics so we can have different retention settings
sudo docker exec influxdb influx bucket create \
  --name net \
  --org admin \
  --retention 7d
Now we need to get the auth token for this new setup so we can use it later.
You will see a Token field, copy that down, we will need it for our influx config.
sudo docker exec influxdb influx auth list
1.4 Update telegraf with token
Now we should still be on the host in the cloned influx-2-docker directory
Edit the docker-compose.yml file and edit the DOCKER_INFLUXDB_INIT_ADMIN_TOKEN and put your token there. This isn’t the most secure way to do this, but were just talking about a home networking setup here.
Now restart the containers. Since we are changing the environment variable to the telegraf container we have to do a full down and full up.
sudo docker compose down
sudo docker compose up -d
Check the telegraf logs again - you should see no errors!
1.5 Verify data in web interface
Login to your host via http://
You should now be able to login with the information in the influx setup command above
After logging in you should now see the getting started page, click the data explorer
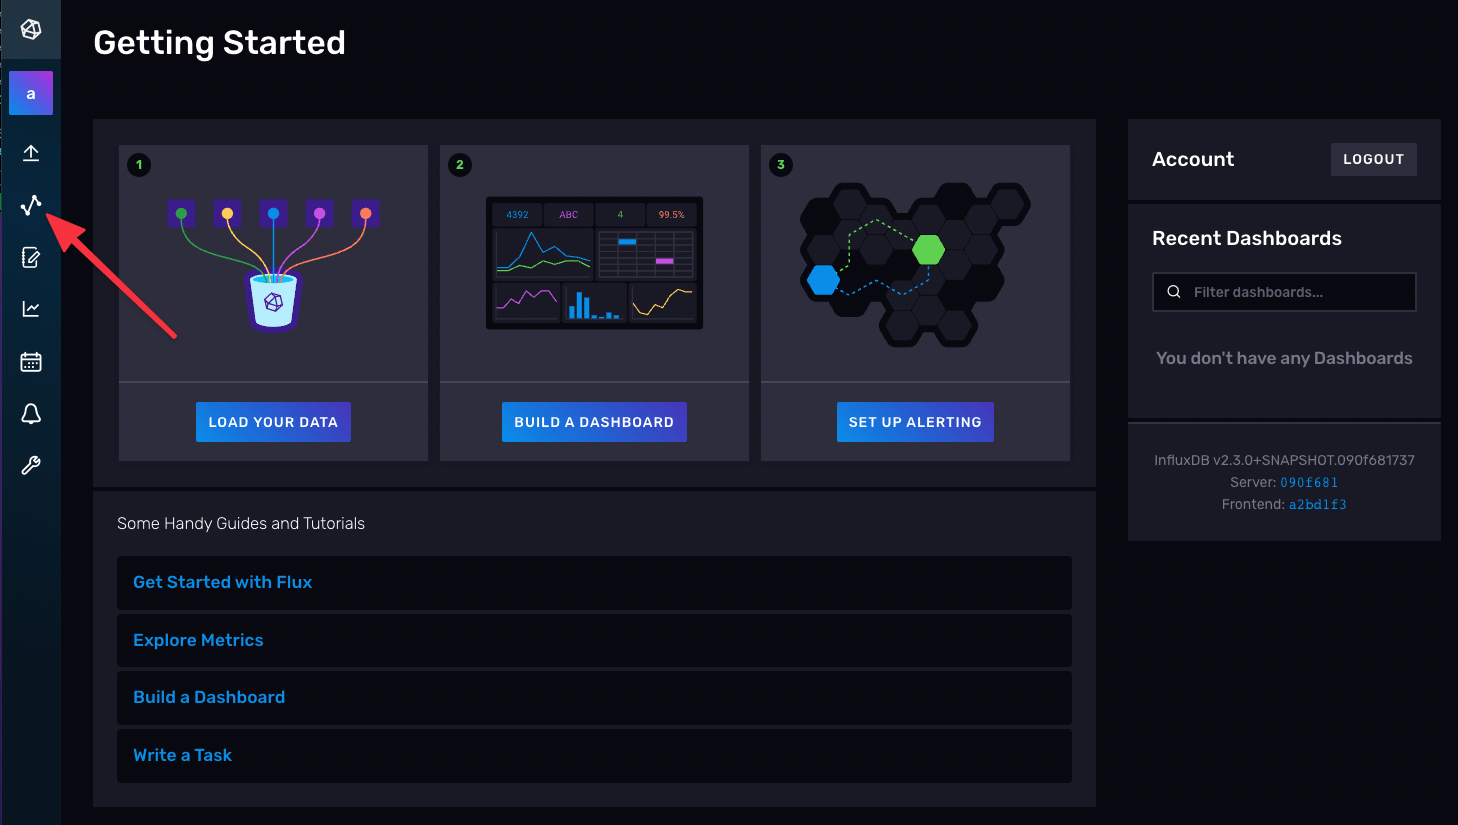
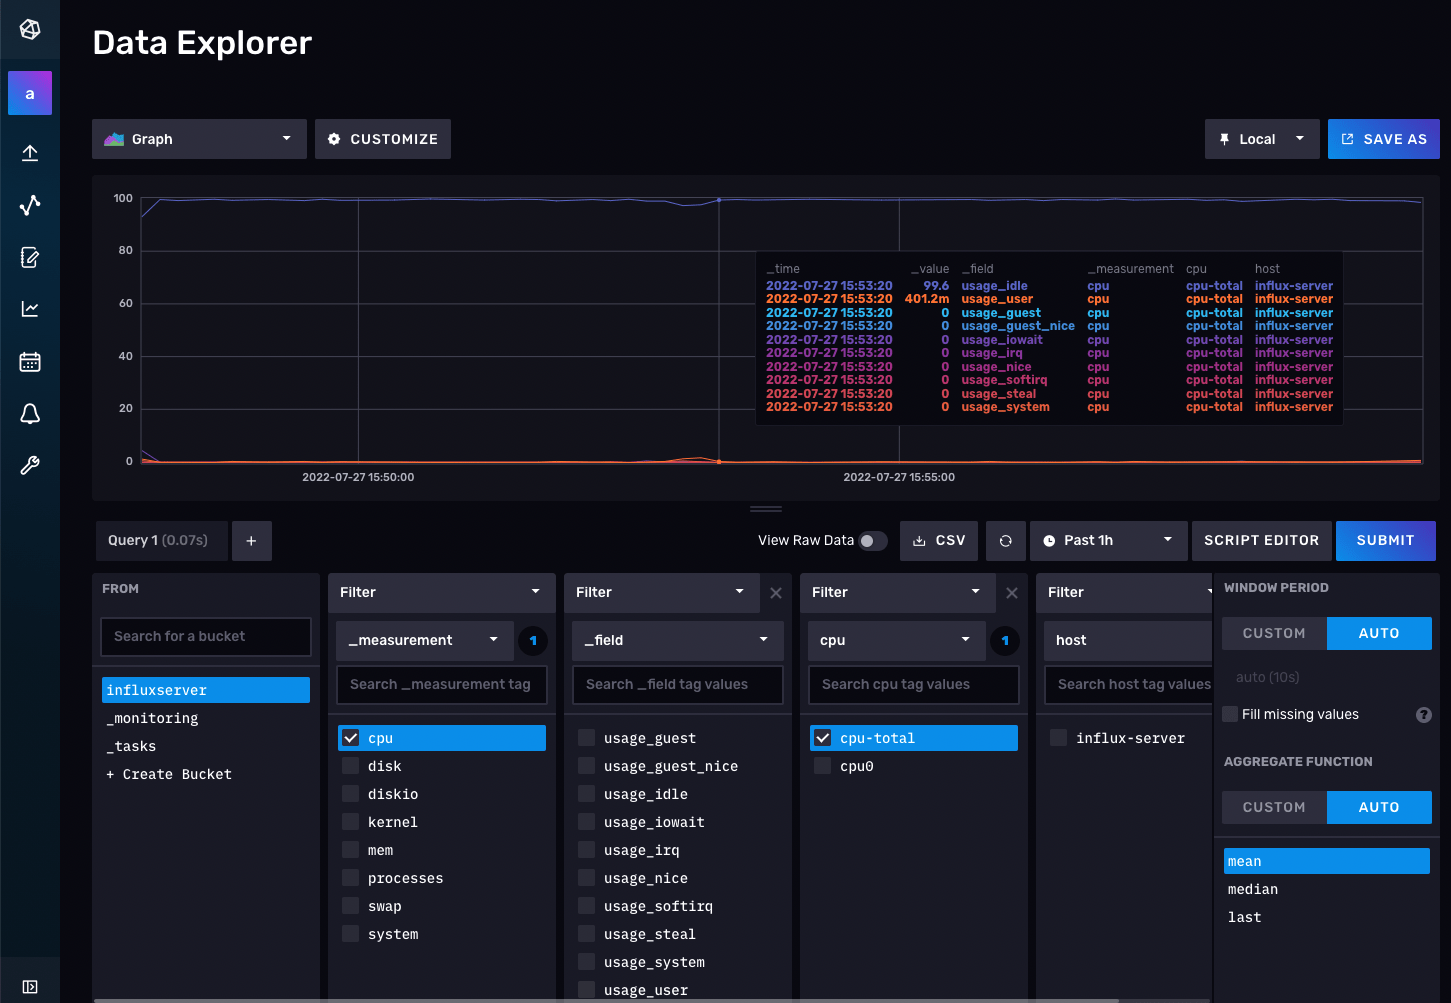
Do a simple query and make sure you see your data, hey there’s our cpu usage!
Step 2: Add some client/workstations
Next we need to get data from our local system into this setup to see the data, create dashboards, alarms and more.
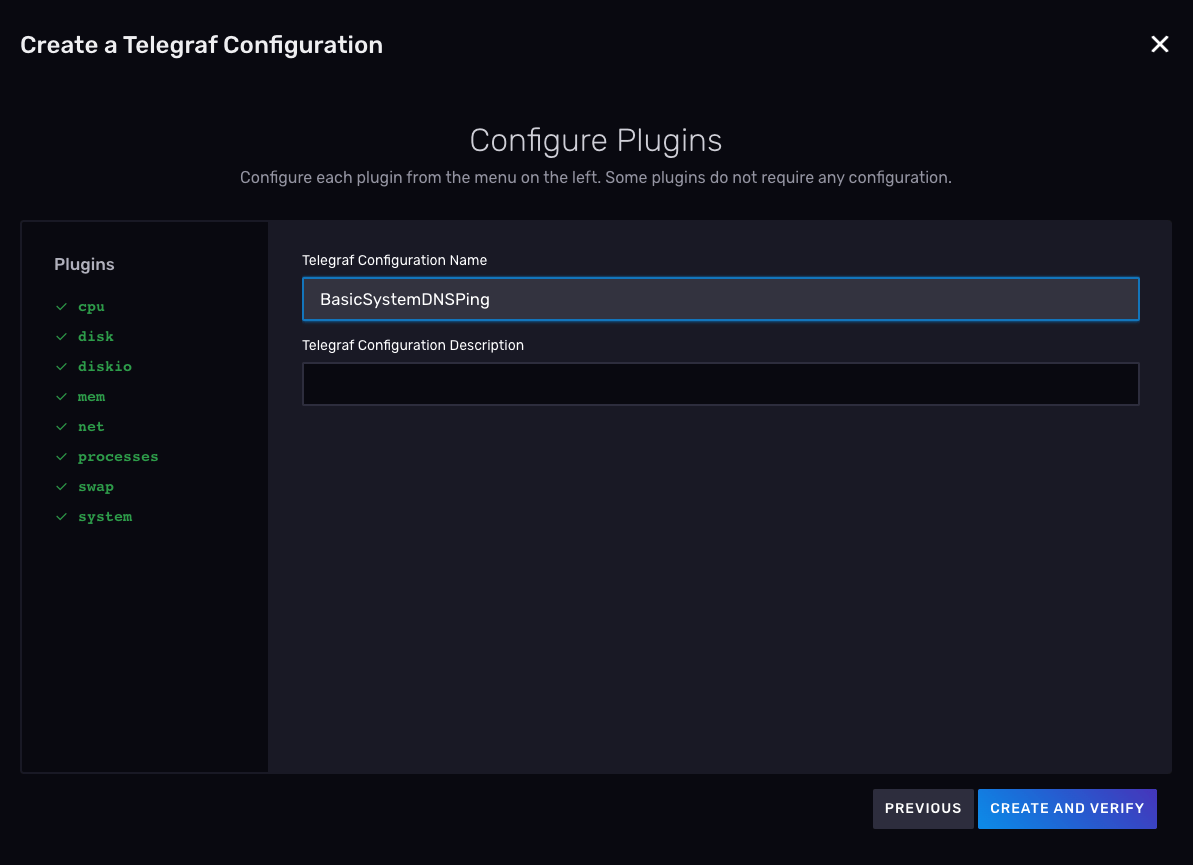
2.1 Setup telegraf config
Create a config (also available via cli)
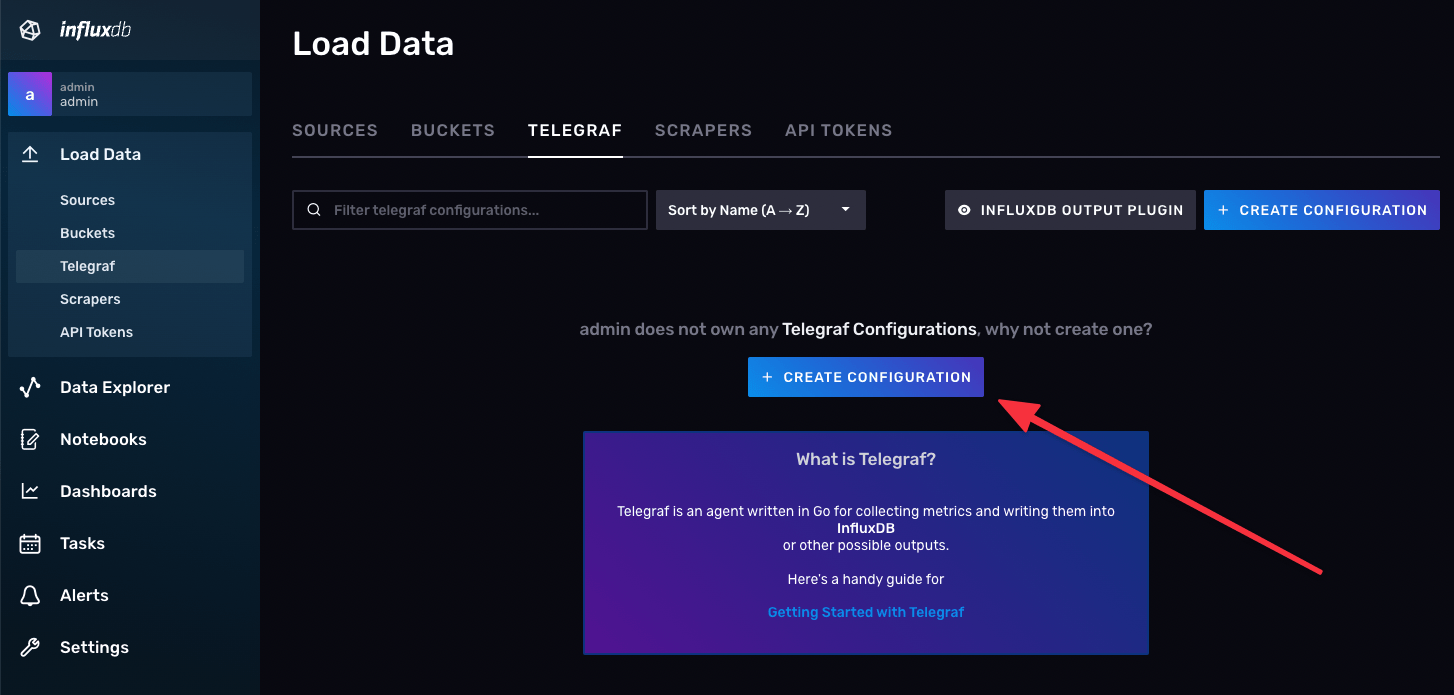
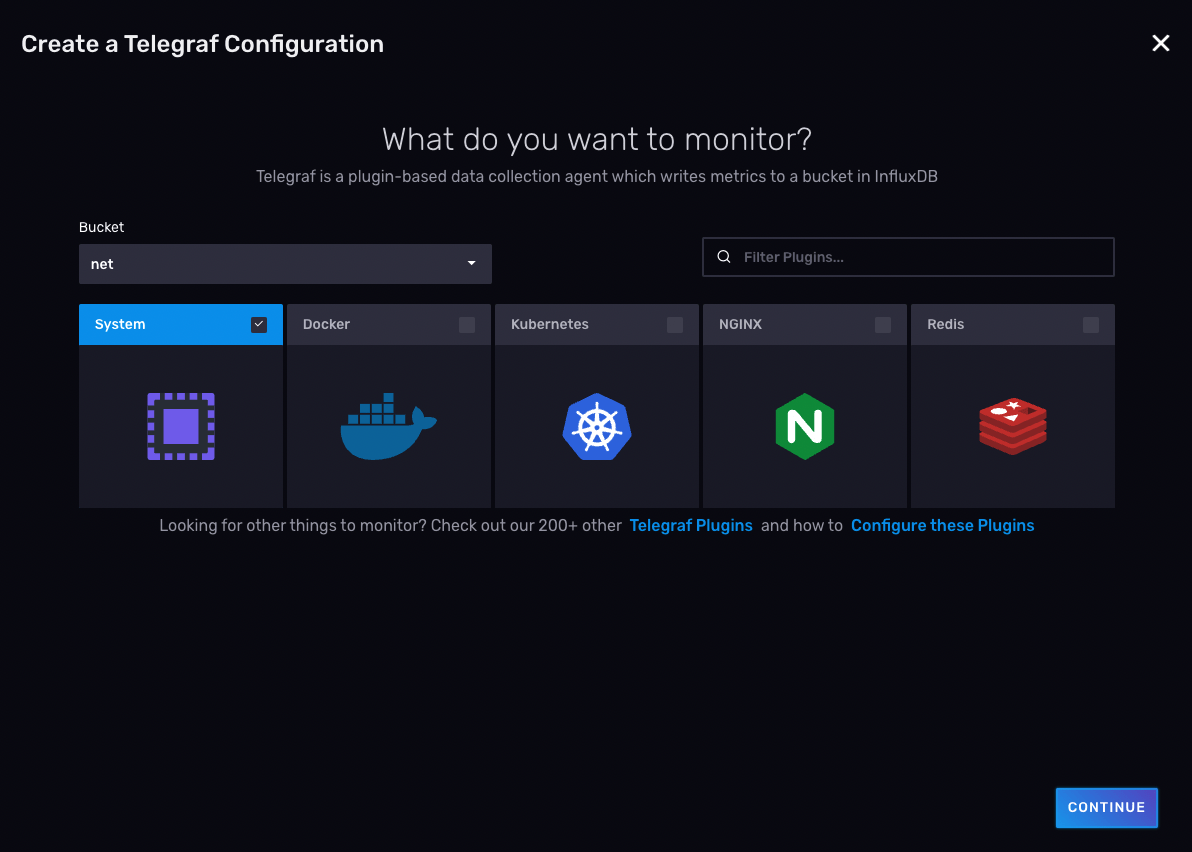
You will then get a screen with your api token and how to run telegraf.
Before we do that, we need to add our ping config, edit the config we setup
At the bottom or where it makes sense, copy and paste the below
# # Query given DNS server and gives statistics
[[inputs.dns_query]]
 # add your isp or currently configured name servers
 servers = ["8.8.8.8", "4.2.2.1"]
 domains = ["www.google.com"]

# # Ping given url(s) and return statistics
[[inputs.ping]]
  ## Add some hosts you want to ping
  urls = ["www.github.com","www.amazon.com","8.8.8.8","4.2.2.1"]

  ## Method used for sending pings, can be either "exec" or "native".  When set
  ## to "exec" the systems ping command will be executed.  When set to "native"
  ## the plugin will send pings directly.
  ##
  ## While the default is "exec" for backwards compatibility, new deployments
  ## are encouraged to use the "native" method for improved compatibility and
  ## performance.
  method = "native"

  ## Number of ping packets to send per interval.  Corresponds to the "-c"
  ## option of the ping command.
  count = 2

  ## Time to wait between sending ping packets in seconds.  Operates like the
  ## "-i" option of the ping command.
  ping_interval = 5.0

  ## If set, the time to wait for a ping response in seconds.  Operates like
  ## the "-W" option of the ping command.
  timeout = 11.0

  ## Interface or source address to send ping from.  Operates like the -I or -S
  ## option of the ping command.
  # interface = "wlan0"
Save the config
2.2 Run the config on an client
On my local setup I will run the telegraf agent after installing it. On mac os x the install is easy brew install telegraf Other ways is on the telegraf downloads page.
Then just run what you copied down earlier
% sudo INFLUX_TOKEN=<token here> telegraf --config http://<ip or host>:8086/api/v2/telegrafs/<uniq id>
2022-07-27T23:52:42Z I! Starting Telegraf 1.23.3
2022-07-27T23:52:42Z I! Loaded inputs: dns_query mem net ping processes swap system
2022-07-27T23:52:42Z I! Loaded aggregators:
2022-07-27T23:52:42Z I! Loaded processors:
2022-07-27T23:52:42Z I! Loaded outputs: influxdb_v2
2022-07-27T23:52:42Z I! Tags enabled: host=Petes-Mac-mini.localdomain
2022-07-27T23:52:42Z I! [agent] Config: Interval:10s, Quiet:false, Hostname:"Petes-Mac-mini.localdomain", Flush Interval:10s
Optional - you can also run telegraf via the docker container if you would like, but you will need to copy the config file manually. I was not able to find a telegraf option with a direct url to config. This was surprising - if this is the standard way to run this which is even recommended by the influx config/website then why isn’t this a standard docker option? Or maybe it is availabe its just not documented?
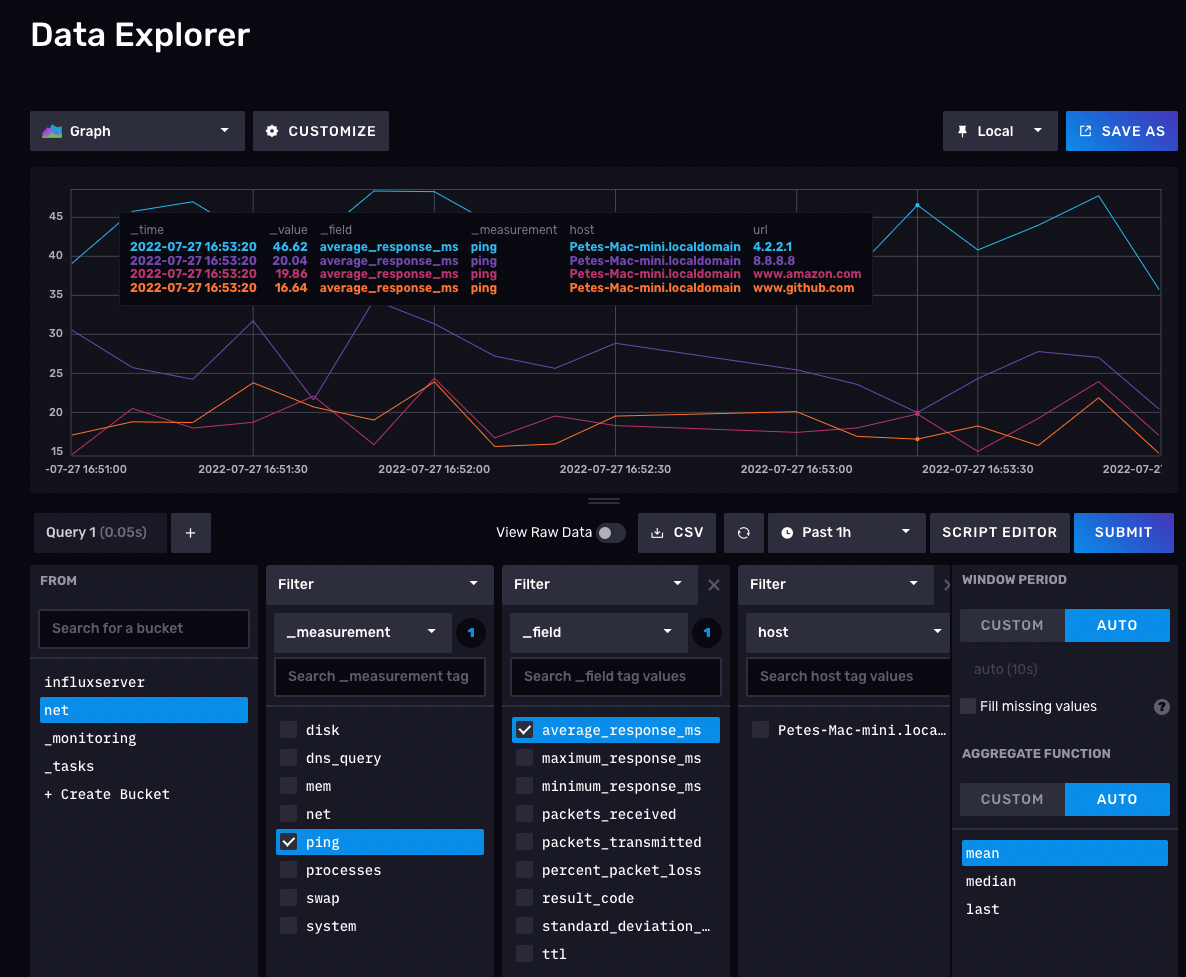
2.3 Check the data
You should now have new metrics available for you. Look, there is our ping data.
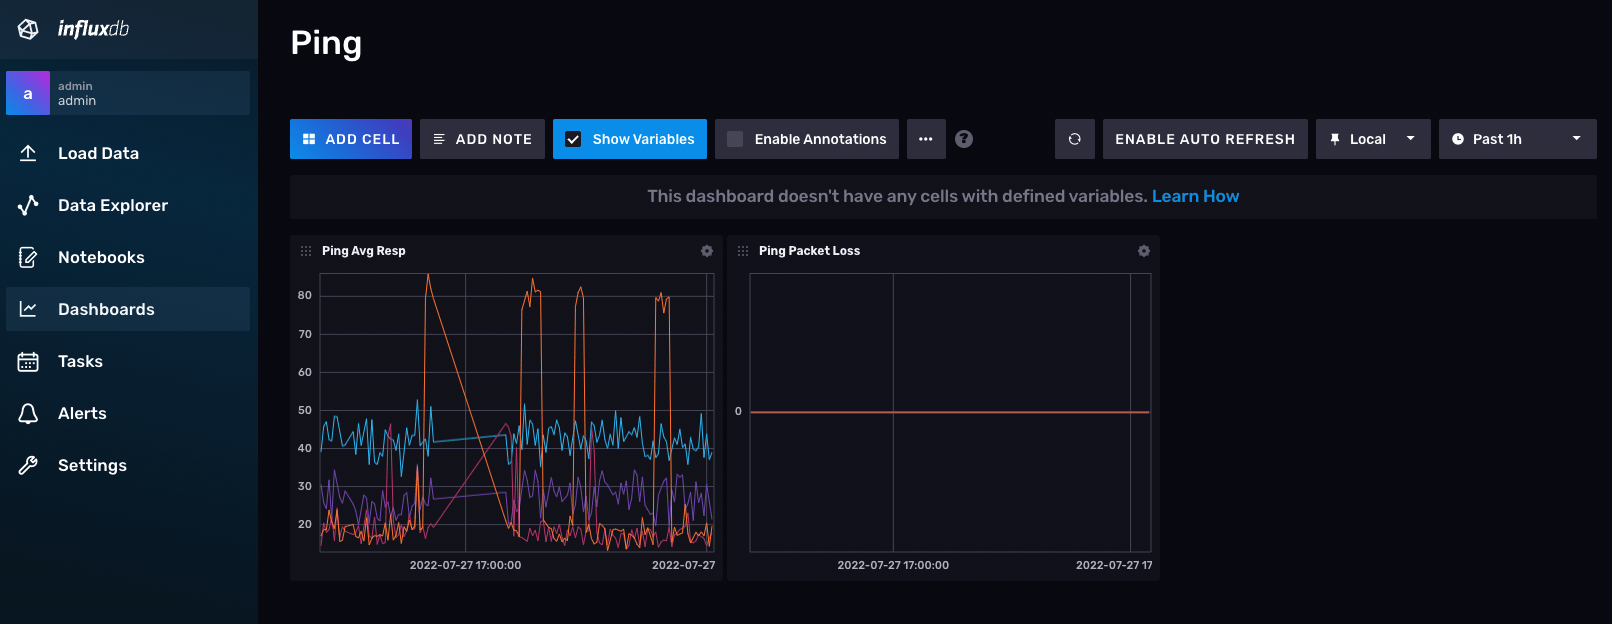
Step 3: Dashboards
Now that we have some data we can use, we can build some dashboards pretty easily so we can get a high level view of how things are going.
Click on the dashboards section and we can setup a quick and easy dashboard for avg response time and packet loss.
And look at that, for some reason we are having high ping times to github.com, but not the others.
Step 4: Setup alerts
So now we have a basic, flexible monitoring system. We can change our agents to monitor whatever we want. But how do we get automatically alerted when something is abnormal in our ping times?
4.1 Basic ping alerts
First lets do the query for average ping
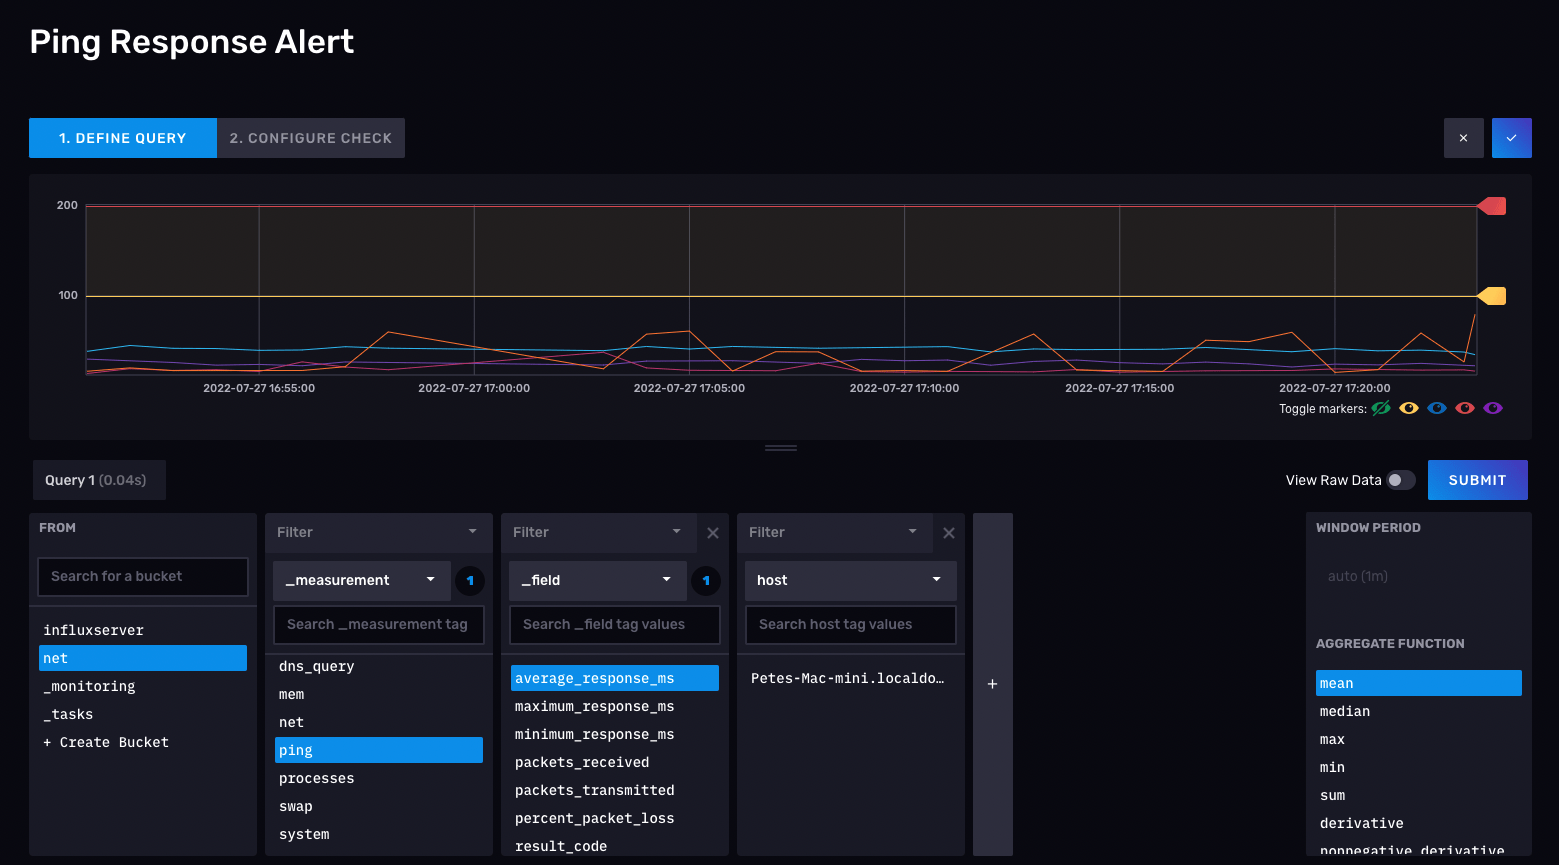
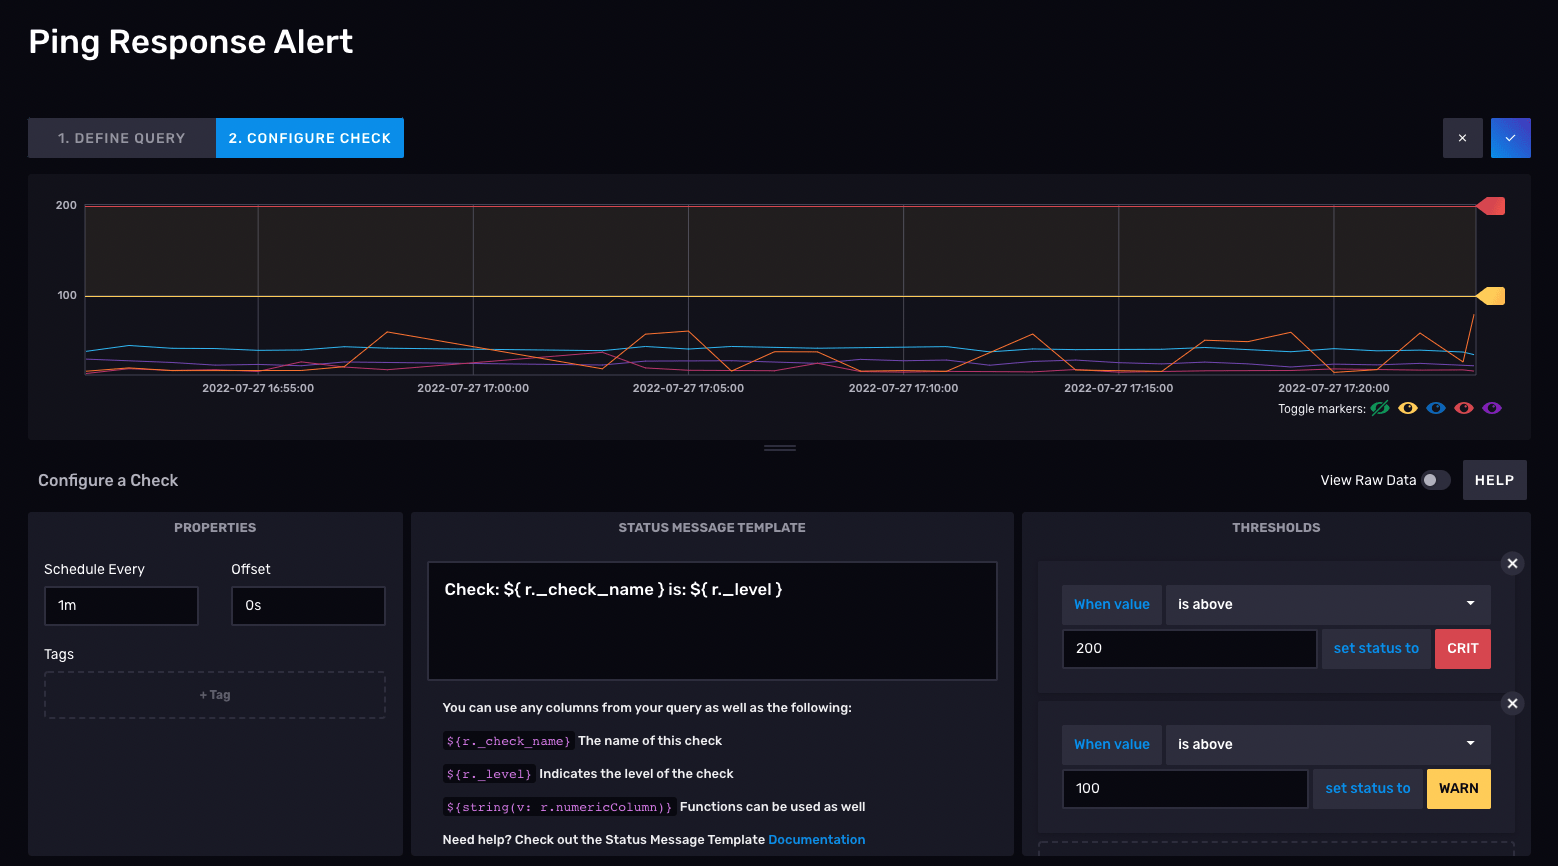
Now lets set warning to 100 and critical to 200
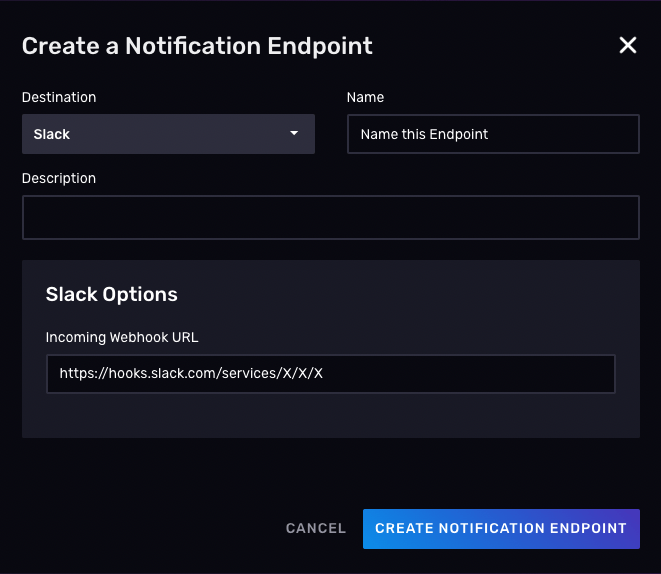
But where will the alert go? On the same alerts page setup a notification endpoint. You can use pager duty, slack or an http webhook.
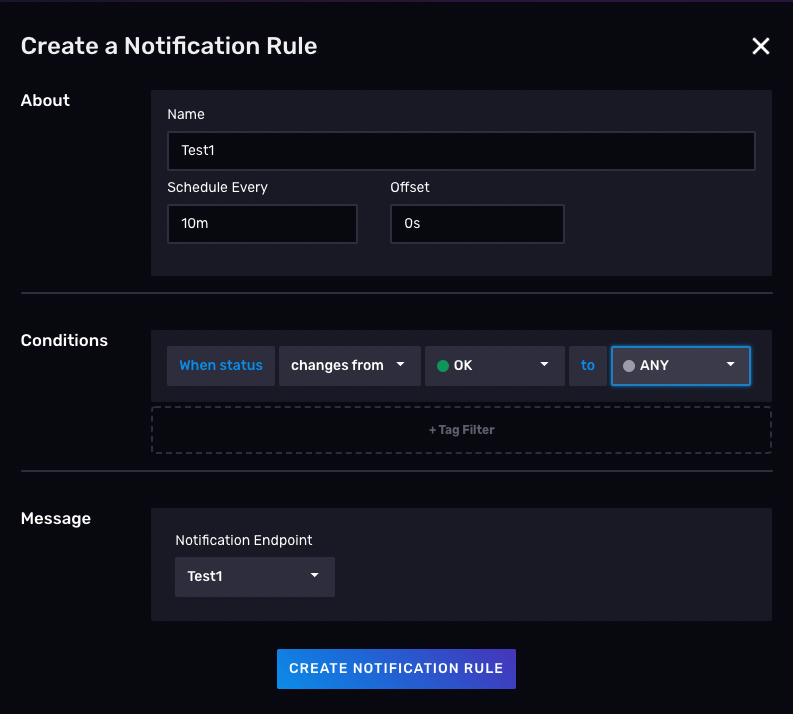
Then we create a rule on when to notify us via that channel
4.2 Alerts on influx itself
We also need some basic alerts on if influxdb is running. If influx isn’t working we won’t get any of our alerts so we can setup a basic check to also alert us.
I am still investigating this portion of what I can do for free. A lambda function on a cron with cloudwatch alerting would work, but that wouldn’t be free.